
Position sizing: decide the loss before the size
Work out how many shares to buy from your account, the most you will risk on one trade and where your stop-loss sits.
RISK PER TRADE
A small, fixed slice of the account
Risk per trade is the most one trade is allowed to take from your account if it goes wrong. It is set as a percentage of the account, and a commonly taught ceiling is 1-2%. This course uses 1%. The point is not the exact number; it is that the number is small, fixed and decided before you look at how exciting the trade seems.
With an account of 10,000 and a 1% rule, one trade may lose at most 100. It does not matter whether the idea feels brilliant or ordinary: the limit is the same.
Check yourself
Sara's account is 10,000 and her rule is to risk 1% per trade. What is the most one trade may lose?
- 10
- 100
- 1,000
- It depends on how confident she feels about the trade
Show the answer
100
Right. 1% of 10,000 is 100. That is her limit on every trade, whatever she thinks of it.
Position size
How many shares (or units) you buy. It comes from three numbers you already know: position size = (account × risk %) ÷ (entry − stop). The top is the money you allow yourself to lose; the bottom, the risk per share, is how much each share loses if the price falls from your entry to your stop-loss.
Account 10,000, risk 1% = 100. Entry 50, stop 48, so each share can lose 2. 100 ÷ 2 = 50 shares.
Account                     10,000
Risk per trade   1%   =      100

Entry                           50
Stop-loss                       48
Risk per share   50 − 48  =      2

Shares           100 ÷ 2  =     50
Position value 50 × 50 = 2,500Buy 50 shares, worth 2,500 (25% of the account).
If the stop is hit: 50 × 2 = 100 lost, which is 1%.The position is a quarter of the account, but the planned loss is only 1% of it. Position size and risk are two different numbers, and the stop-loss is what connects them.
Check yourself
Nima will risk 100 on a trade. He plans to buy at 50 with a stop-loss at 48. How many shares should he buy?
- 2
- 48
- 50
- 200
Show the answer
50
Right. Each share can lose 50 − 48 = 2, and 100 ÷ 2 = 50 shares. If the stop is hit, he loses the 100 he planned.
Step through it
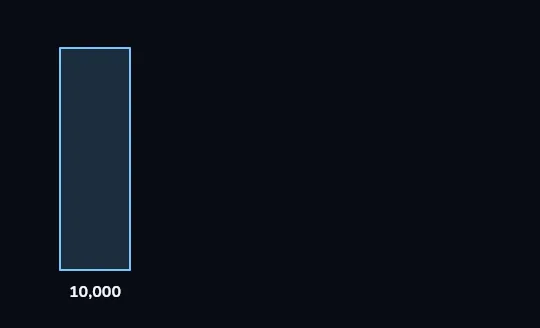
Start with the whole account One tall bar stands for the whole trading account: 10,000. Nothing has been bought yet. Everything that follows is worked out from this one number.
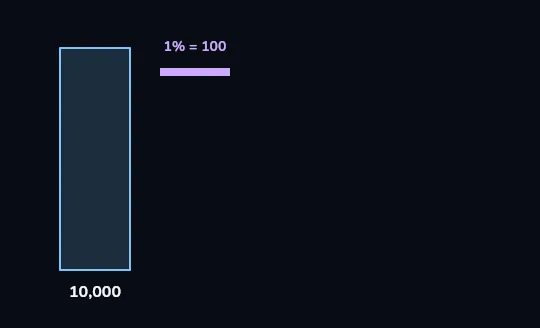
Decide the loss first: 1% = 100 A thin lilac bar appears beside the top of the account, labelled 1% = 100 (drawn thicker than true scale so you can see it). That is the most this one trade may lose, and it is decided before looking at any price.
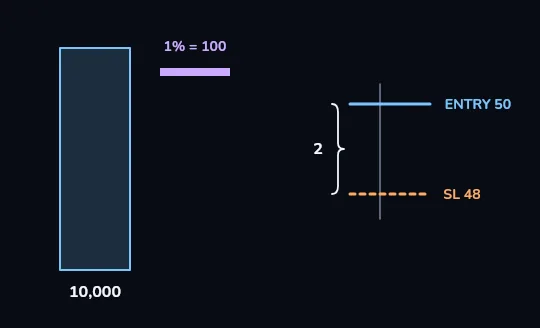
Entry 50, stop 48: each share can lose 2 To the right, a small price axis shows the entry at 50 as a blue line and the stop-loss (SL) at 48 as a dashed orange line. The brace between them reads 2: if the price falls from 50 to 48, each share loses 2.
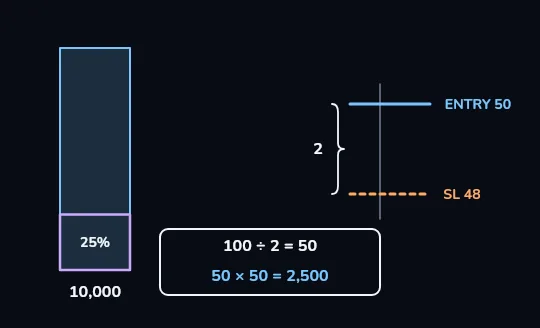
100 ÷ 2 = 50 shares, worth 2,500 A result box underneath reads 100 ÷ 2 = 50 shares, and 50 × 50 = 2,500. The bottom quarter of the account bar is outlined in lilac and marked 25%: that is the position's size. The position is worth 2,500, but if the stop is hit the loss is only 100.
Check yourself
Same account, same 100 at risk, same entry at 50. This time the stop-loss goes at 49. How many shares now?
- 25
- 50
- 100
- The number of shares stays 50 whatever the stop
Show the answer
100
Right. Each share can now lose only 1, so 100 ÷ 1 = 100 shares, a position of 5,000. The risk is still 100: the size followed the stop.
R (R-multiple)
R is the amount you risked on a trade: the loss you planned to take if the stop was hit. Measuring every result in R lets you compare trades of different sizes on one scale. A loss at the stop is −1R; a gain twice as big as the risk is +2R.
In the lesson's trade R = 100. A result of +200 is +2R, −100 is −1R, and +50 is +0.5R. Lesson 12 keeps a whole journal in R.
Ten losses in a row, two risk levels
1% of the balance each time
10,000 × 0.99¹⁰ ≈ 9,044.
Down about 9.6%. Painful, but the account is intact and a normal run of wins can repair it.
10% of the balance each time
10,000 × 0.90¹⁰ ≈ 3,487.
Down about 65%. The account now needs to nearly triple just to get back to where it started.
Check yourself
Leila risked 100 on a trade (R = 100) and closed it with a gain of 300. How would she write the result in her journal?
- +1R
- +3R
- +300R
- +30%
Show the answer
+3R
Right. 300 ÷ 100 = 3, so the trade made +3R: three times what she risked.
Common sizing mistakes
- Sizing by gut, or by what feels exciting, instead of by the formula.
- Moving the stop further away but keeping the same number of shares, which silently raises the risk.
- Forgetting that fees and price gaps (lesson 8) can make the real loss larger than the planned one.
- Treating the position value as the risk. A 2,500 position with a stop can risk 100; the stop decides.
Check yourself
- Omid buys 50 shares at 50 with a stop at 48. If the stop is hit he loses 100, 1% of his 10,000.
- Omid buys the same 50 shares at 50, but moves his stop down to 46 "to give the trade room". He does not change the share count.
What changed between the two trades?
- Nothing important: it is the same 50 shares
- The second trade now risks 200, 2% of the account, because each share can lose 4 instead of 2
- The second trade is safer because the stop is harder to hit
- The second trade risks less, because a wider stop means a smaller loss
Show the answer
The second trade now risks 200, 2% of the account, because each share can lose 4 instead of 2
Exactly. 50 shares × 4 per share = 200 at risk, double his rule. A wider stop needs fewer shares: 100 ÷ 4 = 25 would keep the risk at 100.
Lesson recap
- Decide how much you are willing to lose before deciding how much to buy.
- Risk per trade is a small, fixed share of the account; a commonly taught ceiling is 1-2%, and this course uses 1%.
- Position size = (account × risk %) ÷ (entry − stop). 10,000 at 1% with entry 50 and stop 48 gives 50 shares.
- The stop sets the size: a tighter stop allows more shares, a wider one needs fewer, for the same risk.
- R is the amount risked; results in R compare trades fairly, and small risk per trade is what survives losing streaks.