
Reading candlestick charts
Turn a period of trading into one candle: open, high, low and close, and learn what a chart can describe and what it cannot predict.
FOUR NUMBERS
One candle sums up one period
A candlestick summarises one period of trading with four prices, known as OHLC: the open (the first trade of the period), the high, the low, and the close (the last trade). The length of the period is the chart's timeframe: 1 minute, 1 hour, 1 day, 1 week. On a daily chart, each candle is one day; on a 5-minute chart, each candle is five minutes.
One hour of trading: the first trade was at 100, the price reached 108 at its highest and 97 at its lowest, and the last trade was at 105. That hour is one candle: O 100, H 108, L 97, C 105.
BODY AND WICKS
The thick part and the thin lines
The body is the thick part, drawn from the open to the close. The thin lines above and below it are the wicks (also called shadows): they reach up to the high and down to the low. If the close is above the open, it is an up candle; if below, a down candle. Colours differ between apps: green and red, white and black, and in some East Asian markets red means up. Always check the legend. In this course, up candles are blue and hollow, down candles orange and filled.
O 100, H 108, L 97, C 105: an up candle with its body from 100 to 105, an upper wick to 108 and a lower wick to 97. Next period, O 105, H 106, L 99, C 101: a down candle with its body from 105 down to 101.
Check yourself
A candle has O 100, H 108, L 97, C 105. What kind of candle is it?
- An up candle, because it closed above where it opened
- A down candle, because it fell to 97 at one point
- A down candle, because it closed below its high
- Neither, because it moved both ways
Show the answer
An up candle, because it closed above where it opened
Right. Up or down depends only on the close compared with the open: 105 is above 100. The trip to 97 shows up as the lower wick.
Check yourself
Match each part of the candle O 100, H 108, L 97, C 105 to where you find it
Show the answer
- O 100 → The bottom of the body: the first trade
- C 105 → The top of the body: the last trade
- H 108 → The tip of the upper wick
- L 97 → The tip of the lower wick
READING SHAPES
Wicks tell you where the price was rejected
A candle's shape tells a small story about the period. A long upper wick means the price went up during the period but was pushed back down before the close: sellers took over at the top. A long lower wick is the reverse. A candle with a tiny body and long wicks on both sides, where the open and the close are almost equal, is called a doji: the price wandered both ways and ended where it started, so neither side won that period.
O 50.00, H 51.20, L 48.90, C 50.02: a doji. Plenty happened during the period, but by the close it had come back to almost exactly where it began.
Check yourself
A candle opens at 50 and closes at 50.02, with long wicks up and down. What does it describe?
- A strong rise that is sure to continue
- Indecision: the price moved both ways but neither side won the period
- A market that was closed for most of the period
- A strong fall hidden by the wicks
Show the answer
Indecision: the price moved both ways but neither side won the period
Right. That is a doji. It describes a period where buyers and sellers pushed both ways and it ended almost where it started. It doesn't say what comes next.
Same day, two timeframes
Daily chart
One big up candle: opened at 100, closed at 106. It looks like a strong, steady rise.
Hourly chart of that day
Seven candles: five climbing hours up to 108, then two falling hours down to 106. The last hour of the "strong" day was a clear fall.
VOLUME
How much traded in each period
Under most charts is a row of bars, one per candle. They show volume: how many shares or units traded in that period. A move on high volume involved many trades and participants; the same move on very low volume involved few, and says less about what the wider market thinks. Volume tells you how busy a period was, not which way the next one will go.
Two up candles look identical, but one had 2 million shares traded and the other 50,000. The first involved far more buyers and sellers.
Check yourself
A big up candle on a daily chart means the price rose steadily all day long.
Show the answer
False
False. A daily candle only records four numbers: open, high, low and close. In between, the price could have fallen first, spiked, or dropped in the last hour. Switch to a shorter timeframe to see the path.
Check yourself
A well-known single-candle pattern, like a hammer, reliably predicts which way the price will move next.
Show the answer
False
False. Single-candle patterns describe one period and, on their own, are weak and unreliable as forecasts. They can be part of a picture, never a guarantee.
Step through it
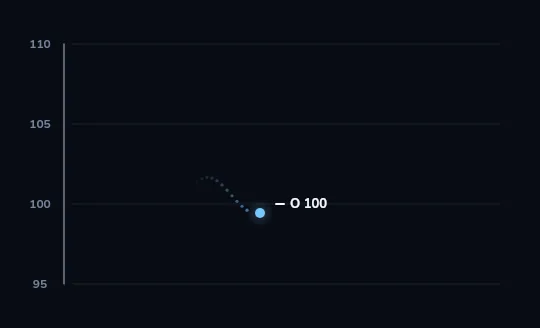
A new period opens at 100 On a price axis from 95 to 110, a small dot marks the first trade of a new period at 100, labelled O 100. It keeps ticking up and down, leaving a faint trail. That first trade, 100, is the open.
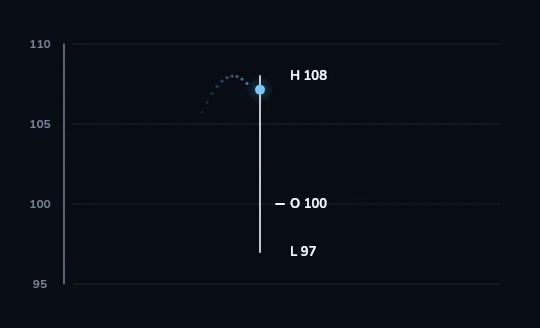
The high 108 and the low 97 The dot has now touched 108 and 97, marked H 108 and L 97, and a thin wick line joins them. During the period the price reached 108 at its highest and fell to 97 at its lowest. The period is not over yet.
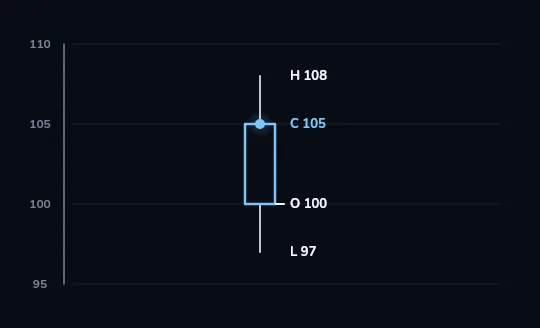
It closes at 105: an up candle The period ends at 105, labelled C 105, and a hollow blue body forms from 100 to 105 on the wick. It closed above the open, so it is an up candle. The wicks above and below the body show how far the price wandered.
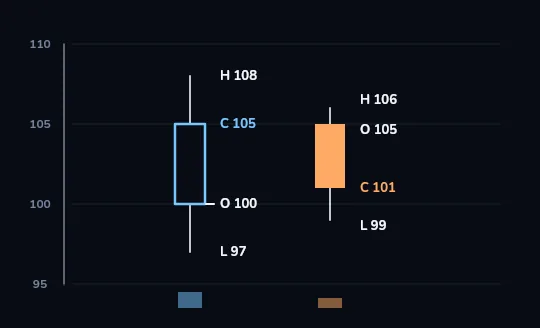
The next period: a down candle, 105 to 101 The finished candle slides left. Beside it, a filled orange candle shows the next period: open 105, high 106, low 99, close 101, a down candle. Two short volume bars sit underneath, one per period. A chart is just these, one after another.
Check yourself
In the last frame, the second candle opened at 105 and closed at 101. Where is its body, and why is it filled?
- From 99 to 106, filled because it fell
- From 101 to 105, filled because it closed below its open
- From 101 to 105, filled because its volume was lower
- From 105 to 108, filled because it couldn't reach the old high
Show the answer
From 101 to 105, filled because it closed below its open
Right. The body always runs from the open to the close, here 105 down to 101. It is filled (orange here) because the close is below the open. 106 and 99 are the wick tips.
Lesson recap
- A candle summarises one period of the chart's timeframe with four prices: open, high, low, close (OHLC).
- The body runs from open to close; the wicks reach the high and the low.
- Close above open is an up candle, close below open a down candle. Colours vary by app, so check the legend.
- A long wick shows where the price was pushed back; a doji, with open and close nearly equal, shows neither side won the period.
- The same day can look very different on a daily and an hourly chart. Volume shows how much traded in each period.
- A candle records what happened. Single-candle patterns are weak forecasts. Education, not financial advice.