
Correlation is not causation
Two things rising together can mean one causes the other, the reverse, a hidden third cause, or pure coincidence; here's how to tell.
Correlation
Two measures tend to move together. In a positive correlation both rise together; in a negative one, as one rises the other falls. A scatter plot shows it as a cloud of dots with a slope. The correlation coefficient r runs from −1 to +1: near +1 or −1 is a tight straight-line pattern, and 0 means no straight-line pattern at all.
Height and shoe size: positive. Outside temperature and heating bills: negative.
Check yourself
Which of these pairs is most likely a negative correlation?
- Hours of study and exam scores
- Hours of daylight and household heating bills
- A child's age and their height
- Size of a house and its price
Show the answer
Hours of daylight and household heating bills
Right. As the days get longer and warmer, heating bills tend to fall: one up, the other down. The other pairs tend to rise together.
Step through it
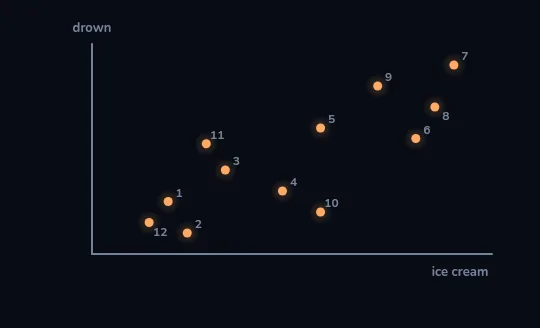
Twelve months: ice cream and drownings Each orange dot is one month of the year, numbered 1 to 12: ice-cream sales across, drownings up. The summer months 6 to 9 sit high and to the right, the winter months 12, 1 and 2 low and to the left. They rise together.
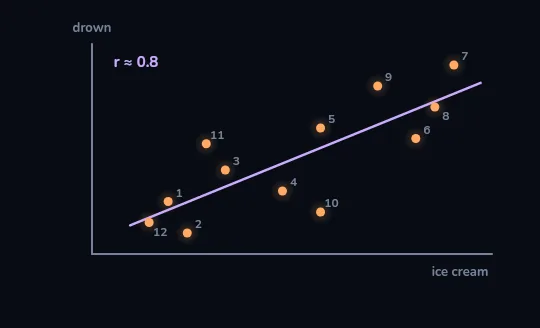
A strong positive correlation A lilac trend line runs up through the cloud, labelled r ≈ 0.8: a strong positive correlation. It's tempting to draw an arrow straight from ice cream to drowning.
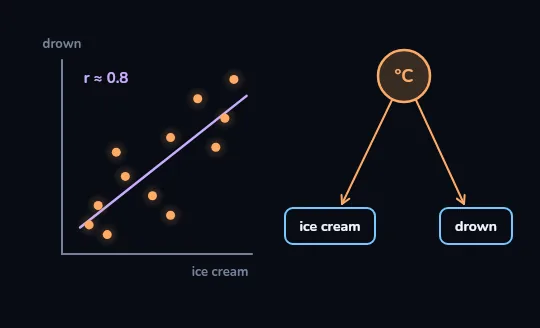
The hidden driver: hot weather The plot shrinks to the left. On the right, a circle marked °C, hot weather, sends one arrow to ice cream and another to drownings. Heat sells ice cream, and heat sends people swimming.
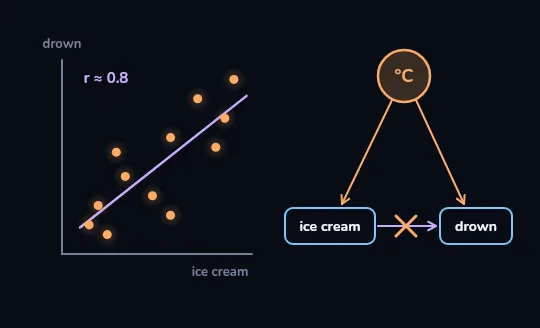
The direct arrow is crossed out An arrow from ice cream straight to drownings appears between the two boxes and is crossed out. Neither causes the other: a third factor, a confounder, moves both at once.
Check yourself
Ice-cream sales and drownings rise together in summer. What is the best explanation?
- Eating ice cream makes people worse swimmers
- Drownings make people buy ice cream
- A third factor, hot weather, drives both
- It's a coincidence that happens only in one country
Show the answer
A third factor, hot weather, drives both
Right. Hot weather brings out both the ice-cream buyers and the swimmers. Take away the heat and the link between the two disappears.
THE THIRD VARIABLE
Confounders: the cause hiding behind both
A confounder is a third factor that drives both things you're looking at, so they move together without either causing the other. It's the most common reason a correlation misleads. A close cousin is selection: comparing groups that chose themselves, so they differ in many ways at once.
People who take vitamin pills tend to be healthier. But they also tend to exercise more, smoke less and earn more. Any of those could explain the gap, so the pills may be getting credit for the lifestyle.
Check yourself
"Children with more books at home get better grades." Which of these is a likely confounder?
- The colour of the books' covers
- Their parents' income and education
- The day of the week the grades were given
- The size of the school's library
Show the answer
Their parents' income and education
Right. Better-off, more educated parents tend to buy more books and also give their children many other advantages, like help with homework, a quiet room and tutoring. That can drive both.
Two more ways a correlation fools you
Reverse causation
The arrow runs the other way. "People who use walking sticks are less healthy": the sticks don't cause the ill health, the ill health causes the sticks. "Cities with more police have more crime": often more crime is why a city hires more police.
Coincidence
Search enough data and some series will line up by pure chance. Well-known joke charts match, for example, cheese eaten per person with deaths from getting tangled in bedsheets. The fewer the data points and the more series searched, the easier this is.
Check yourself
Sort these headlines: does each one claim only a link, or does it claim a cause?
- Coffee linked to longer life
- Coffee cuts your risk of stroke
- Screen time associated with poorer sleep
- Screens make teenagers anxious
- Walking tied to fewer sick days
- Walking causes weight loss
Show the answer
Only a link: Coffee linked to longer life, Screen time associated with poorer sleep, Walking tied to fewer sick days
Claims a cause: Coffee cuts your risk of stroke, Screens make teenagers anxious, Walking causes weight loss
How a cause actually gets shown
- Best: a randomised experiment
Assign people to groups at random, so confounders end up spread evenly between them. Lesson 11 shows how.
- Timing
The cause has to come before the effect.
- Dose-response
More of the cause goes with more of the effect: heavier smokers get lung cancer more often than light smokers.
- A plausible mechanism
There's a sensible way the one could lead to the other.
- Consistency
Many studies, in different places and groups, find the same thing. Smoking and lung cancer were established this way, largely from observational data.
Check yourself
A correlation of 0.9 proves that one thing causes the other.
Show the answer
False
False. r only measures how tightly the dots follow a straight line. A confounder, reverse causation or coincidence can all produce a correlation of 0.9. Ice cream and drownings had r ≈ 0.8 with no causal link at all.
Check yourself
- A small kitchen fire: 4 firefighters come, and the damage costs about 2,000.
- A huge warehouse fire: 40 firefighters come, and the damage costs about 500,000. Across many fires, more firefighters go with more damage.
What best explains the pattern?
- Firefighters cause damage, so fewer should be sent
- Bigger fires bring more firefighters and also cause more damage; fire size is the confounder
- It's pure coincidence and would vanish with more data
- The damage causes firefighters to work more slowly
Show the answer
Bigger fires bring more firefighters and also cause more damage; fire size is the confounder
Exactly. The size of the fire drives both the number of firefighters sent and the damage done. Compare fires of the same size and, if anything, more firefighters mean less damage.
Lesson recap
- A correlation means two measures tend to move together; r runs from −1 to +1 and measures only how tight the straight-line pattern is.
- Ice-cream sales and drownings had r ≈ 0.8, but hot weather, a confounder, drives both.
- Before believing a cause, check for a confounder, reverse causation, selection and plain coincidence.
- "Linked to", "associated with" and "tied to" signal a correlation; "causes" and "cuts your risk" claim a cause.
- Causes are shown best by randomised experiments, or by timing, dose-response, a mechanism and consistent findings together.