
Putting it together: reading a headline
One realistic headline, taken apart with the whole course: which average, what sample, what kind of study, relative or absolute, and how it was drawn.
QUESTION 1 · LESSON 8
Relative or absolute?
"50% less likely" is a relative change. The paper's actual numbers: over ten years, condition Z appeared in about 2 in 1,000 non-drinkers and 1 in 1,000 coffee drinkers. That's a 50% drop, and also just 1 case fewer per 1,000 people, or 0.1 percentage points. Put another way, about 1,000 people would have to drink coffee for ten years for one fewer case, and that's only if coffee were the cause.
Same numbers, two headlines: "50% less likely" and "1 fewer case in 1,000 people over ten years".
Check yourself
The risk of condition Z falls from 2 in 1,000 to 1 in 1,000. Which is the absolute change?
- 50%
- 1 in 1,000, or 0.1 percentage points
- 1 percentage point
- 2 to 1, a halving
Show the answer
1 in 1,000, or 0.1 percentage points
Right. The absolute change is the plain gap: 2 − 1 = 1 case per 1,000 people, which is 0.1 percentage points. "50%" and "a halving" are the relative version.
Step through it

The headline card A headline card with a small Z in the corner and a big orange −50% in the middle: coffee drinkers 50% less likely to get condition Z. Nothing has been checked yet. Let's check it.
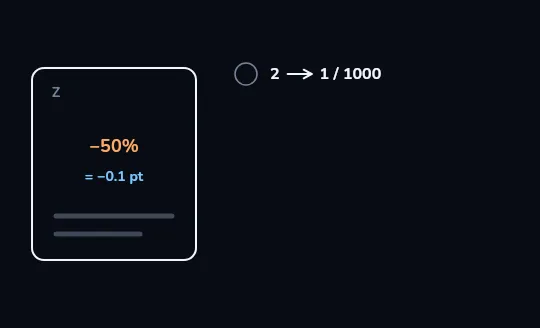
Check 1: relative or absolute? The first check row appears beside the card, with an empty circle and 2 → 1 / 1000. Under the −50% on the card, a small = −0.1 pt is added. The risk went from 2 to 1 in every 1,000 people: a real drop, but a tiny one.
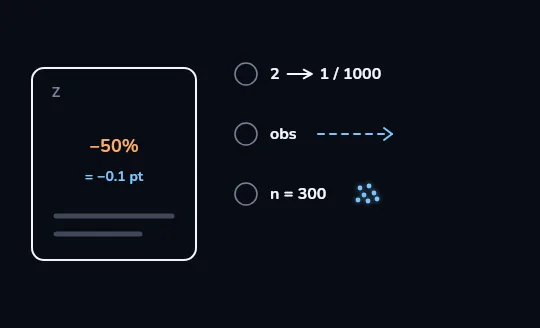
Checks 2 and 3: what study, how many? Two more rows appear. obs, with a dashed arrow, means an observational study: an association, not proof of cause. n = 300, with a small cluster of dots, is the number of people. At 1 or 2 cases per 1,000, a group of 300 is far too small to measure a difference that rare.

Check 4, and the number shrinks A fourth row reads p = 0.04, 1 / 20: one "significant" result among 20 foods tested, about what luck alone would give. All four rows get lilac ticks, and the −50% on the card fades from orange to grey. After four questions, the scary-sounding number is much smaller and much less certain.
Check yourself
The study simply observed people who chose whether to drink coffee. Which headline verb is honest?
- "Coffee cuts the risk of Z"
- "Coffee linked to lower risk of Z"
- "Coffee prevents Z"
- "Coffee cures Z"
Show the answer
"Coffee linked to lower risk of Z"
Right. People chose their own coffee habits, and coffee drinkers may differ in income, health or smoking. An observational study shows a link; "cuts" and "prevents" claim a cause it can't show.
QUESTIONS 3 AND 4 · LESSONS 4, 5 AND 10
Who, how many, and how sure?
The study followed 300 people from one clinic. That's a small group, and not a random sample of anyone but that clinic's patients. It's also too small for such a rare condition: at 1 or 2 cases per 1,000, you'd expect well under one case among 300 people, so ask how many cases the comparison really rests on. The paper's interval, "between 10% and 80% lower", is very wide, which is another way of saying the estimate is shaky. And its p = 0.04 was one hit among 20 foods the researchers tested, about what chance alone would produce.
When the numbers in a headline don't add up with the sample size, that alone is a reason to wait for a bigger study.
Two more checks: the average and the chart
Which average? (lessons 1-3)
A follow-up line says "the average coffee drinker has 4 cups a day".
A few very heavy drinkers can pull the mean up to 4 while the median, the typical drinker, has 2.
How is it drawn? (lesson 9)
The article's bar chart of the two risks starts its axis at 0.8 in 1,000.
Bars of 1 and 2 become 0.2 and 1.2 units tall: one risk looks six times the other, when it's really double.
Check yourself
Match each check to what it caught in the coffee headline
Show the answer
- Relative or absolute? → "50% less" is 1 fewer case per 1,000
- What kind of study? → Observational: a link, not a cause
- Who and how many? → 300 people from one clinic
- Significant, and does it matter? → p = 0.04, one hit among 20 foods
- How is it drawn? → Bar axis starting at 0.8 in 1,000
QUESTION 7 · LESSONS 7 AND 11
The base rate and the bigger picture
Condition Z is rare to begin with, about 2 in 1,000 over ten years, so even a real halving changes very little for any one person. And one study is not a body of evidence. The last question is what other studies say: have systematic reviews or large trials looked at coffee and Z? If a single small observational study disagrees with a pile of larger ones, the pile usually wins.
"What's the base rate?" and "What do other studies say?" are the two questions most headlines never answer.
The checklist to keep
- Relative or absolute?
Find the starting risk. "Out of how many?"
- What kind of study?
Randomised trial or observational? Animals or people? "Linked to" or "causes"?
- Who and how many?
A random sample or one clinic? Tens, hundreds or tens of thousands?
- How uncertain?
How wide is the interval or margin of error? Was it one lucky p-value among many tests?
- Which average, and what spread?
Mean or median? Could a few extreme values be pulling it?
- How was it drawn?
Where does the axis start? Counts or rates? Which dates?
- What's the base rate, and what do other studies say?
Rare to begin with? One study, or a body of evidence?
Check yourself
Which rewritten headline is the most accurate?
- "Coffee halves your risk of condition Z"
- "Scientists prove coffee protects against Z"
- "In one small observational study, coffee drinkers had slightly fewer cases of Z (1 vs 2 per 1,000)"
- "Coffee has no effect on Z"
Show the answer
"In one small observational study, coffee drinkers had slightly fewer cases of Z (1 vs 2 per 1,000)"
Right. It gives the absolute numbers, says the study was small and observational, and doesn't claim a cause. Less exciting, and far closer to what the study can support.
Check yourself
Once a headline fails a few of these checks, you can conclude that coffee has no effect on condition Z.
Show the answer
False
False. The checks show that this study can't support a strong claim. That's different from showing there's no effect. The honest conclusion is "we don't know yet", and the next step is to see what larger, better studies say.
Course recap
- "50% less likely" was 2 → 1 cases per 1,000 over ten years: a drop of 0.1 percentage points.
- An observational study of 300 people from one clinic can show a link, not a cause, and is far too small for a condition this rare.
- p = 0.04 among 20 foods tested is about what chance alone would give.
- Ask which average, how the chart was drawn, what the base rate is and what other studies say.
- The checklist sorts solid numbers from flimsy ones; finish by writing the honest headline yourself.