
P-values in plain words
A p-value asks one question – how surprising would this result be if nothing were going on? – and it doesn't answer the questions people usually think it does.
Null hypothesis
The starting assumption that nothing is going on: the coin is fair, the drug does nothing, the two groups are the same. A study doesn't prove the null hypothesis; it asks whether the data would look strange if it were true.
Testing whether a coin is biased, the null hypothesis is "the coin is fair", so heads come up half the time.
THE ONE QUESTION
How surprising, if nothing were going on?
The p-value answers: if the null hypothesis were true, how often would we see a result at least this extreme just by chance? A small p-value means the result would be rare under "nothing going on", which makes that assumption harder to believe. A large p-value means the result is the kind of thing chance produces all the time.
A fair coin tossed 100 times usually gives somewhere between about 40 and 60 heads. A result of 52 is ordinary; a result of 65 would be rare.
Check yourself
Mina wants to test whether a new fertiliser helps plants grow. What is the null hypothesis?
- The fertiliser makes plants grow faster
- The fertiliser makes no difference to growth
- The fertiliser harms the plants
- The plants will grow exactly 10% faster
Show the answer
The fertiliser makes no difference to growth
Right. The null hypothesis is the "nothing is going on" starting point: no difference. The study then asks whether the results would be surprising if that were true.
Step through it
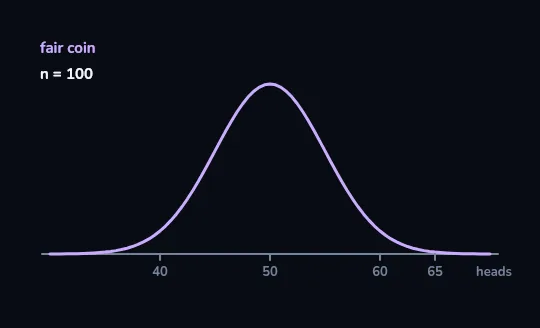
What a fair coin does in 100 flips A lilac bell-shaped curve over an axis of heads, marked 40, 50, 60 and 65. If the coin is fair, 100 flips usually give around 50 heads; the curve shows how often each result would happen, highest at 50 and thinning out to either side.
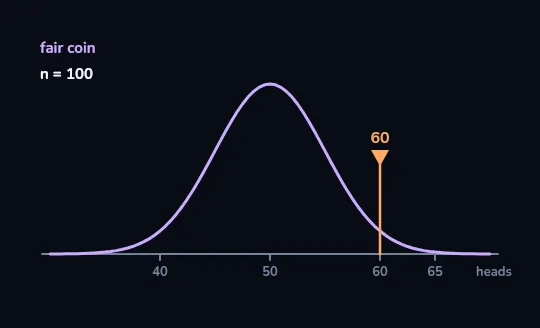
We got 60 heads An orange marker drops onto the axis at 60, on the right shoulder of the curve. We flipped the coin 100 times and got 60 heads. Is that strange for a fair coin?
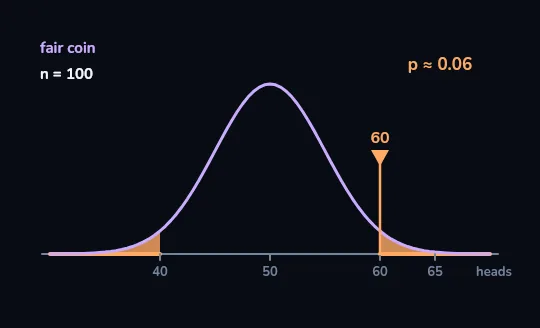
Both tails shaded: p ≈ 0.06 The two tails of the curve are shaded orange: 60 heads or more on the right, and 40 or fewer on the left. Results at least this far from 50, in either direction, happen about 6% of the time with a fair coin. That share, p ≈ 0.06, is the p-value.
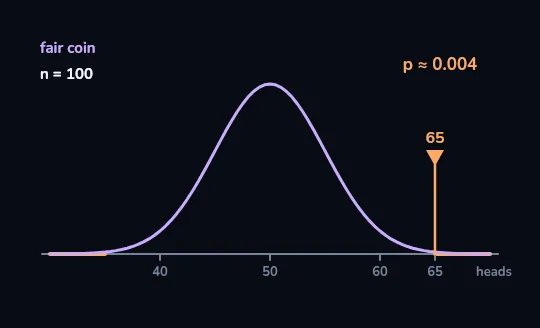
At 65 heads: p ≈ 0.004 The marker moves to 65 and the shaded tails, 65 or more and 35 or fewer, shrink to thin slivers at the ends of the curve. A fair coin would land this far from 50 only about 4 times in 1,000, p ≈ 0.004. Now "the coin is fair" is hard to believe.
Check yourself
100 flips give 60 heads, and p ≈ 0.06. Which statement is right?
- There's a 6% chance the coin is fair
- There's a 94% chance the coin is biased
- If the coin were fair, a result this far from 50 would happen about 6% of the time
- The coin lands heads 6% more often than it should
Show the answer
If the coin were fair, a result this far from 50 would happen about 6% of the time
Right. The p-value starts by assuming the coin is fair and asks how often chance alone would give a result this extreme. It says nothing directly about the probability that the coin is fair.
A LINE DRAWN BY HABIT
Statistically significant: p below 0.05
By convention, going back to a rule of thumb from the statistician R. A. Fisher, a result with p < 0.05 is called statistically significant. It's a habit, not a law of nature. A p of 0.049 and a p of 0.051 are practically the same evidence, even though one gets called significant and the other doesn't. And a result that is "not significant" doesn't prove there's no effect: the study may simply have been too small to see it.
Our coin with 60 heads (p ≈ 0.06) just misses the line. That doesn't make the coin fair; it means 100 flips aren't quite enough to be confident.
Check yourself
A result of p = 0.01 means there's a 99% chance the treatment works.
Show the answer
False
False. p = 0.01 means that if the treatment did nothing, results at least this extreme would turn up about 1% of the time. That's not the same as the chance the treatment works, which also depends on how plausible it was to begin with and on how well the study was done.
What a p-value is not
- Not the probability that the null hypothesis is true.
- Not the probability that the result is "just a fluke" in the everyday sense.
- Not a measure of how big or important the effect is.
- These points follow the American Statistical Association's 2016 statement on p-values, written because the misreadings were so common.
Significant is not the same as important
Huge study, tiny effect
500,000 people. A pill lowers blood pressure by 0.5 points on average.
The p-value is tiny, but the effect size is too small to matter to anyone's health.
Small study, big effect
40 people. A treatment seems to cut pain by a third.
The p-value might be above 0.05. Worth a bigger study, not worth ignoring.
Check yourself
A study of 500,000 people finds that a diet leads to a statistically significant weight loss of 0.1 kg. What's the fairest reading?
- It's significant, so the diet works well
- Probably not important: with a sample this big, even a tiny effect can be significant
- It must be a mistake, since big studies can't find small effects
- 0.1 kg is significant, so it's worth recommending to everyone
Show the answer
Probably not important: with a sample this big, even a tiny effect can be significant
Right. Huge samples can detect very small effects, so a tiny p-value doesn't mean a big effect. Always ask for the effect size: here, 0.1 kg, which matters to almost nobody.
Check yourself
- A researcher plans one test in advance: does eating beans lower cholesterol? She gets p = 0.04.
- Another researcher tests 20 different foods against a disease, and reports only the one with p = 0.04.
Both found p = 0.04. Why should you trust the second result less?
- Beans are healthier than other foods
- With 20 tries, about one result near p = 0.05 is expected by chance alone
- The second researcher used a smaller p-value
- Diseases can't be studied with p-values
Show the answer
With 20 tries, about one result near p = 0.05 is expected by chance alone
Exactly. The same p-value means less when it's the best of 20 attempts. One planned test that hits p = 0.04 is modest evidence; the one lucky winner among 20 is roughly what chance alone would give you.
Lesson recap
- The null hypothesis is the "nothing is going on" assumption, like "the coin is fair".
- A p-value is how often chance alone would give a result at least this extreme if the null were true: 60 heads in 100 flips gives p ≈ 0.06, 65 heads p ≈ 0.004.
- p < 0.05 is a habit, not a law; 0.049 and 0.051 are practically the same, and "not significant" doesn't prove no effect.
- A p-value isn't the chance the null is true, and it isn't the size of the effect: always ask how big the difference is.
- Test 20 useless things and about one will look significant by luck, so be wary of a single hit among many tests.